

Beginner’s Guide to Performance Testing With Apache JMeter - Basic Tutorial

In the last few decades, we're seeing intense growth in the Software Testing industry. It's also important for us to ensure the performance of a software application is required to ensure that the application runs without any failures.
This article will provide in-depth knowledge about the Apache JMeter performance testing tool for analyzing and measuring in the following sequence:
- What is Performance Testing?
- What is JMeter and how does it work?
- Advantages of JMeter
- JMeter Installation Process
- Components of JMeter
- Creating our First Sample JMeter Script
What is Performance Testing?
 Performance testing is a practice to determine how a system performs in terms of responsiveness, stability under a particular workload. It may be from different geo-locations and for different user scenarios.
A few years ago, Flipkart, India’s largest E-Commerce company, encountered issues on its Big Billion Day sale progressed. The payment gateway was down and consumers could not finalize their purchases. Also, in its attempt to limit access only via the mobile application, Flipkart’s sale began with application crashes due to unknown reasons. On the day of the Big Billion Day sale, Flipkart’s customers could not properly access the website due to slow server access.
Poor performance, whether website crashes or slow page loading, equals an immediate and long-term loss of revenue and needs immediate churn.
Any website, big or small, have downtime, and there are disruptions, however negligible. Be it payment gateway downtime, app crashes or server issues, the fact of the matter is, when the load gets heavy or the traffic is pouring in, website applications and mobile applications tend to face severe performance issues.
Performance Testing also serves to investigate, measure, validate different attributes of a system such as -
- Speed: The system is tested and evaluated to check the speed with which it responds -Scalability: Checks the variation in response time/scalability as the load on the system varies
- Reliability: Validates whether the app is reliable under prolonged periods of high user traffic
- Stability: Evaluates if the system is stable under heavy concurrent user load
Types and Tools of Performance Testing
What are the Different Types of Performance Testing?
Load testing: Load testing is performed to validate the system (application under test) performance under normal (usually around 70% of peak user load) and peak user load. This type of test helps us to tune the system and finalize the baseline.
Stress testing: This type of testing is done to identify the breaking point of the system when its subjected to a user load beyond the expected peak. The breaking point can be defined as a load at which either the response time degrades beyond 10% or transactions start falling by more than 5%. Usually, we subject the system to up to 2x of peak user load during the stress tests
Spike testing: It analyzes the behaviour of the system by suddenly varying the number of users and also checks if the system can support such situations efficiently.
Endurance testing: It is a non-functional type of performance testing which typically checks the behaviour of a system when it is under significant load (around 70% of peak load) for a longer period of time (usually 8 hours to 72 hours). The system is checked if any resources leakage occurs like memory leaks, system failing, etc.
Capacity testing: Also known as scalability testing, helps to identify the actual number of users that the system can support with current hardware capacity.
Volume testing: Performance is checked by executing multiple data-intensive transactions and validating how efficiently the system behaves for such data volumes.
There are several performance tools available such as :
- Apache JMeter
- LoadRunner
- WebLOAD
- LoadNinja
- LoadView
- Rational Performance Tester
Apache JMeter is one of the most preferred tools used widely by most QA Engineers. Let's check in detail.
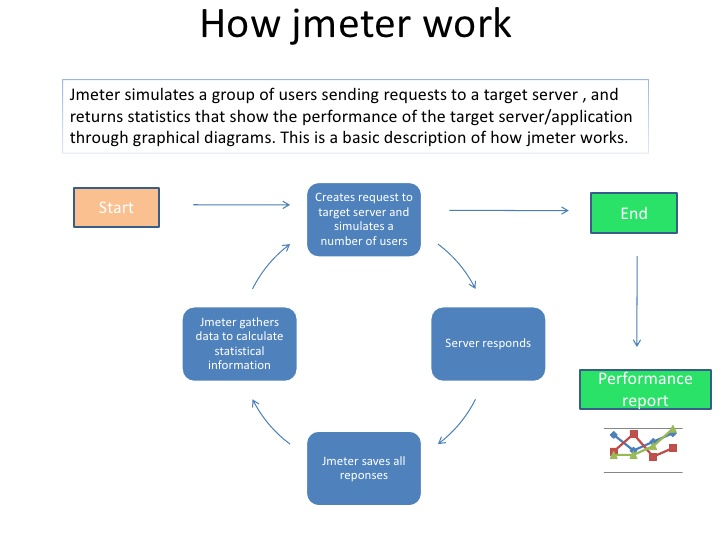
What is JMeter and how does it work?

Apache JMeter™ is a pure Java-based, Open source software application used to load test functional behaviour and measure performance.
It's a non-functional testing tool used to simulate a heavy load on a Server or Group of Servers in a network to test the strength or to analyse and measure the performance of different software services and products under different load types.
As JMeter is an HTTP client it can run multiple sessions in parallel also configurable to our needs.
Features included in it,
It has the ability to performance test many different applications/server/protocol such as:
- Web - HTTP, HTTPS (Java, NodeJS, PHP, ASP.NET, …)
- SOAP / REST Webservices
- FTP
- Database via JDBC
- LDAP
- Message-oriented middleware (MOM) via JMS
- Mail - SMTP(S), POP3(S) and IMAP(S)
- Native commands or shell scripts
- TCP
- Java Objects
- Has Command-Line Integration/headless mode to load test any Java-compatible OS (can be Linux, Win, Mac., )
- Includes Reporting feature in HTML , JSON , XML or any textual format.
- Multi-threading feature allows users concurrent sampling by many threads and simultaneous sampling of different functions by separate thread groups.
Apache JMeter™ is NOT a browser, it works at a protocol level. It looks like a browser but, doesn't perform all the actions done by the browser.
Advantages of JMeter
- Open Source - As its an open-source software. We can download free of cost.
- User-Friendly - It's GUI helps to create a Test Plan easily and configuring respective elements. Just need to right-click on the scenario and add them.
- Recording - It also allows user to record HTTP/HTTPS to create a Test plan using Recording. Uses Proxy Server that allows JMeter to watch and record actions while browsing web application with a normal browser.
- Reporting - Supports different kinds of dashboard report generation. A host of reports are generated through JMeter which helps the user to understand Performance test execution results.
- Support other non-functional tests - It is not only designed to perform Performance Testing but also supports other non-functional tests such as Stress Testing, Distributed Testing, Web service testing, etc.
JMeter Installation Process
As Apache JMeter™ is a pure Java-based application, it requires the latest JVM. To know if your system holds the latest version of Java you can just type the below command in the command prompt.
java -version
The latest version can be downloaded here. Once done, you can simply unzip the zip/tar file into the respective directory you want JMeter to be installed. Here, we don't have any installation screen to deal with.
Once downloaded, you can just navigate to the below path to start JMeter in Graphical User Interface.
/bin/jmeter.bat for Windows machine
/bin/jmeter.shell for Mac or Linux machine
You must be able to view the below screen once launched.
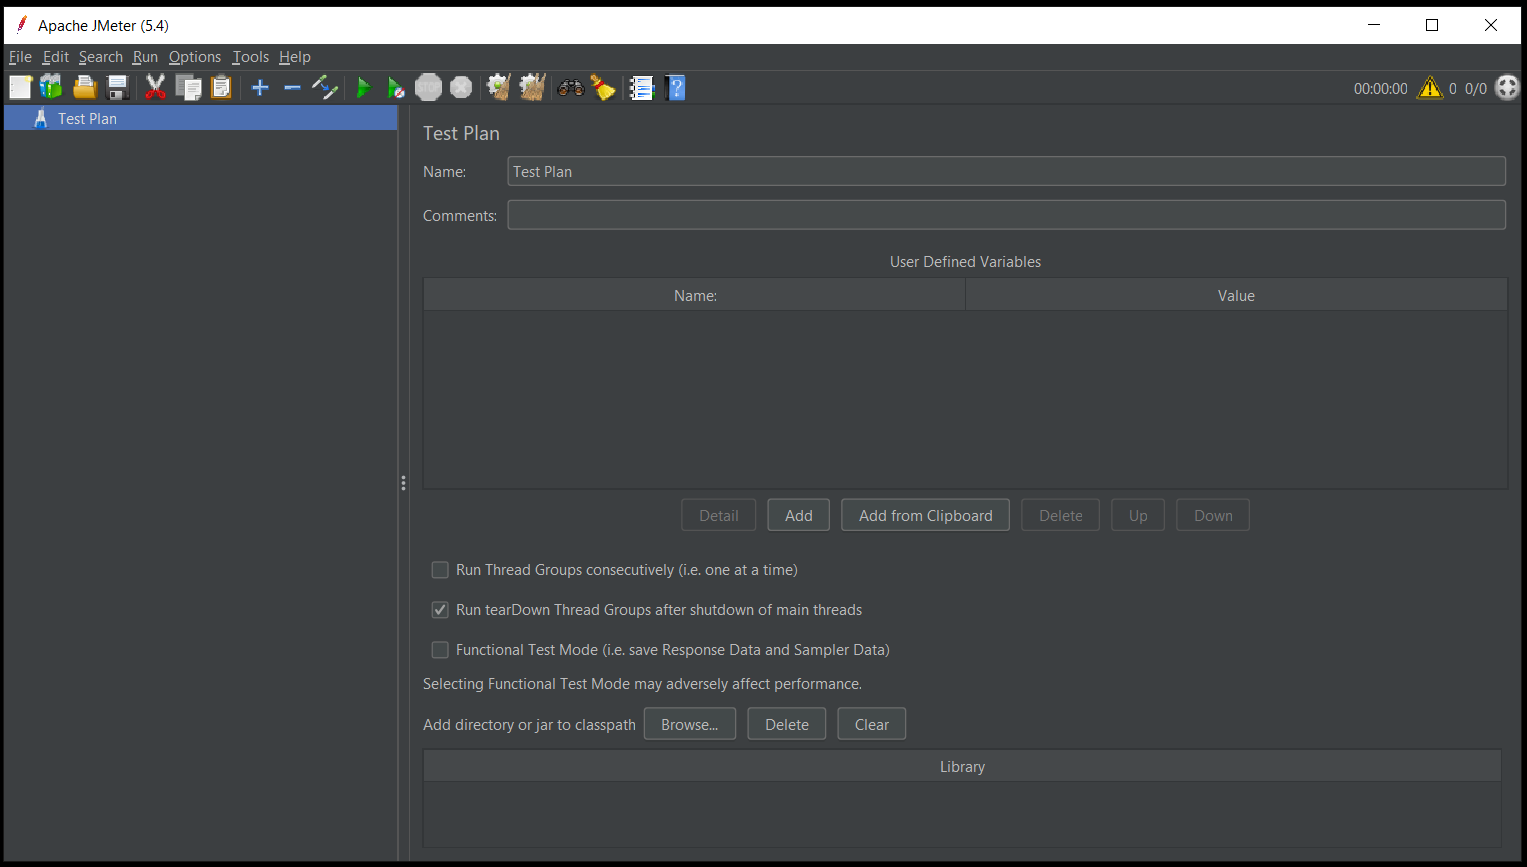
Are you unable to see the GUI yet?
If you cannot see the GUI yet, you should check the following:
JAVA_HOME environment points to the JRE or JDK installation folder. JAVA_HOME/bin folder has been added to the PATH environment variable.
Now, let's move ahead by looking into the components and creating our First script in JMeter.
Components of JMeter
Beforehand, let's look into the components of JMeter (also referred to as Elements).
Thread Group(s): - It's the beginning point of any Test Plan. It's also referred to as a collection of threads, where each of them represents one user using up the application under Test.
For Example - If a Thread Group holds no# of threads as 10, JMeter will create and simulate 10 virtual user requests to the application under Test.
Thread Group also controls the ramp-up period, if the script consists of 10 threads followed by the ramp-up period of 50 seconds then JMeter takes 50 seconds to complete all the 10 threads. Each thread takes up 5 (50/10) seconds after the previous thread was begun. Default, thread group is configured to loop once throughout its elements.
We can also specify as Thread lifetime. Just clicking the Checkbox named Specify Thread Lifetime by configuring Duration (in Sec) and Startup Delay (in Sec). When the test gets started, JMeter will wait for Startup Delay (sec) before starting the Threads of the Thread Group and run for the configured Duration (sec) time.
Samplers: - It holds the actual Work of JMeter i.e., by sending requests to the server and waiting for the responses. JMeter holds below a few list of samplers -
- FTP Request: This controller lets you send an FTP “download file” or “upload file” request to an FTP server.
- HTTP Request: This Lets you send an HTTP/HTTPS request to a web server. (can also be used for SOAP or REST Webservice)
- JDBC Request: This lets you execute Database Performance Testing. It sends a JDBC Request to a database.
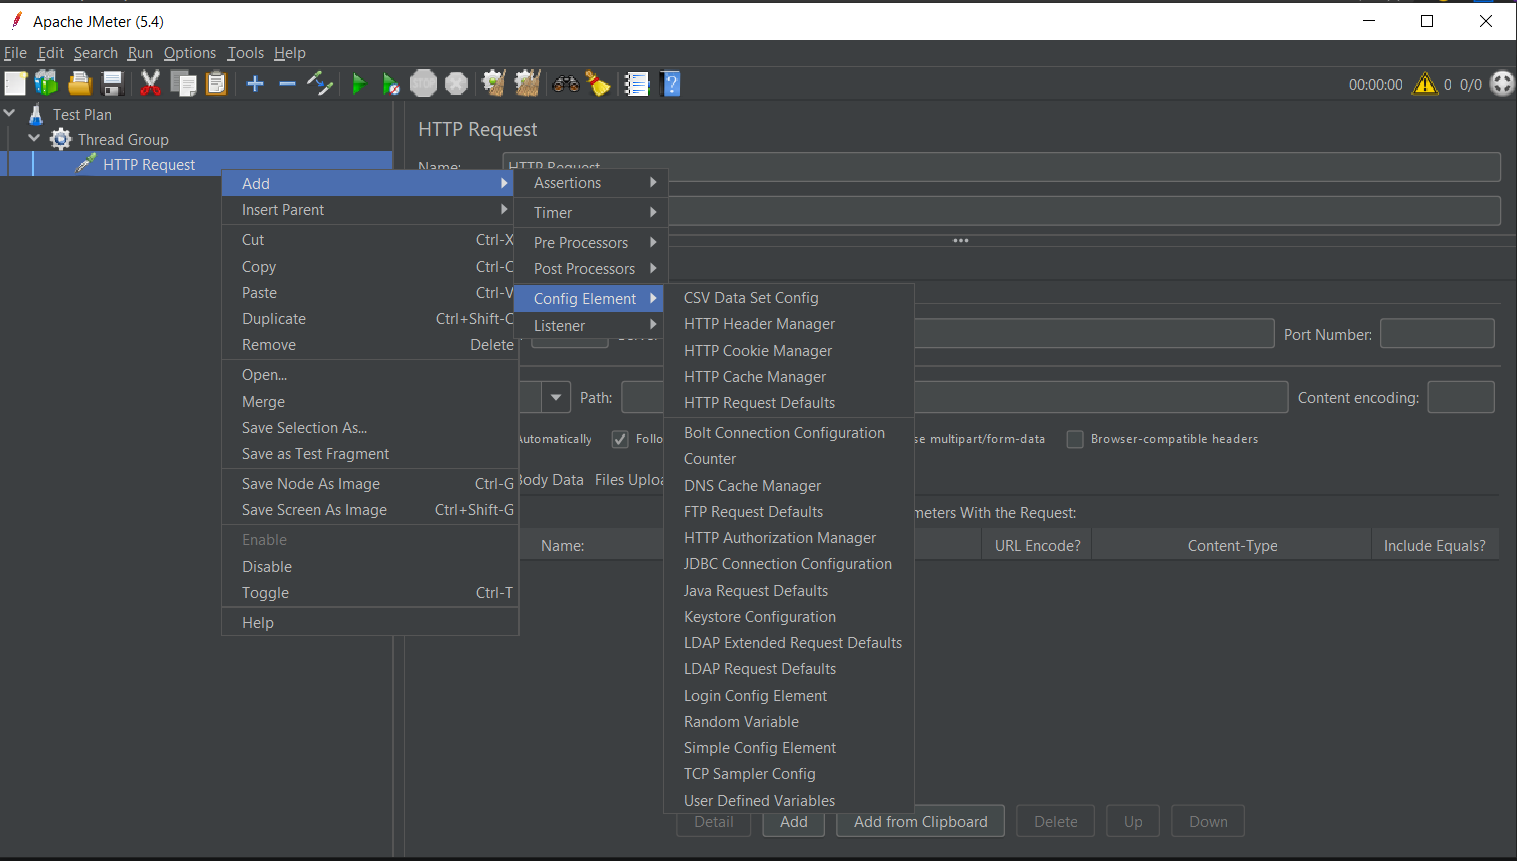
Each of the samplers holds several properties. We can further customize a sampler by adding one or more Configuration Elements to the Test Plan.
Logic Controllers: - It determines which order in which samplers would actually process. Let's use customize the logic that JMeter uses to decide when to send the request.
Listeners: - Helps to gather information about the Test Cases while JMeter runs. All the listeners have the same data but, the only difference in them is the way the data is presented up on the screen.
Configuration: - Used to add up variables used in the Samplers. Though it doesn't send any requests it can modify the requests.
Assertions: - Helps to add up checks on the responses received from the Samplers. Using this, we can ensure that the application is returning up the responses as expected.
Timers: - Used to have user-defined timers between the Requests sent. By default, JMeter executes all the samplers in a Test Case in order without any pause. The timer will pause JMeter to delay for a certain amount of time before each of the samplers.
Pre-Processor: - Used to take actions before any of the Sampler Request sent to the server. Such as modifying settings of a Sample Request before it runs, or to update variables.
Post-Processor: - Used to take actions after the Sampler Request has sent to the server. Such as extracting data from the response received.
Order of the Execution of the Elements would be as -
- Configuration Elements
- Pre-Processor
- Timers
- Samplers
- Post-Processor
- Assertions
- Listeners
Creating our First Sample JMeter Script
Let’s create a simple test plan.
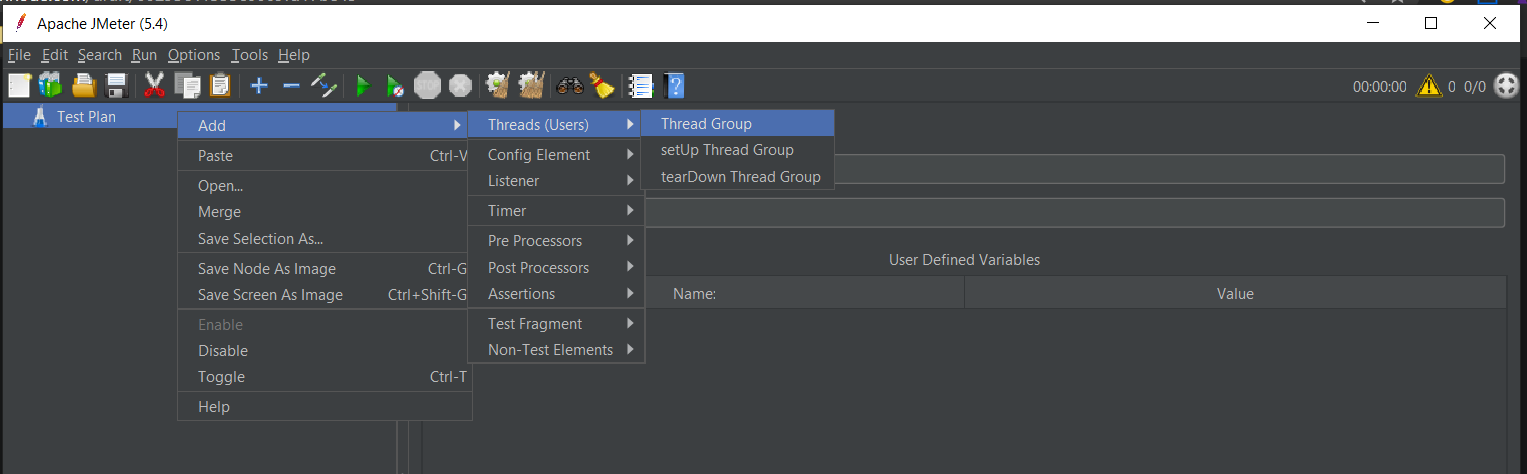
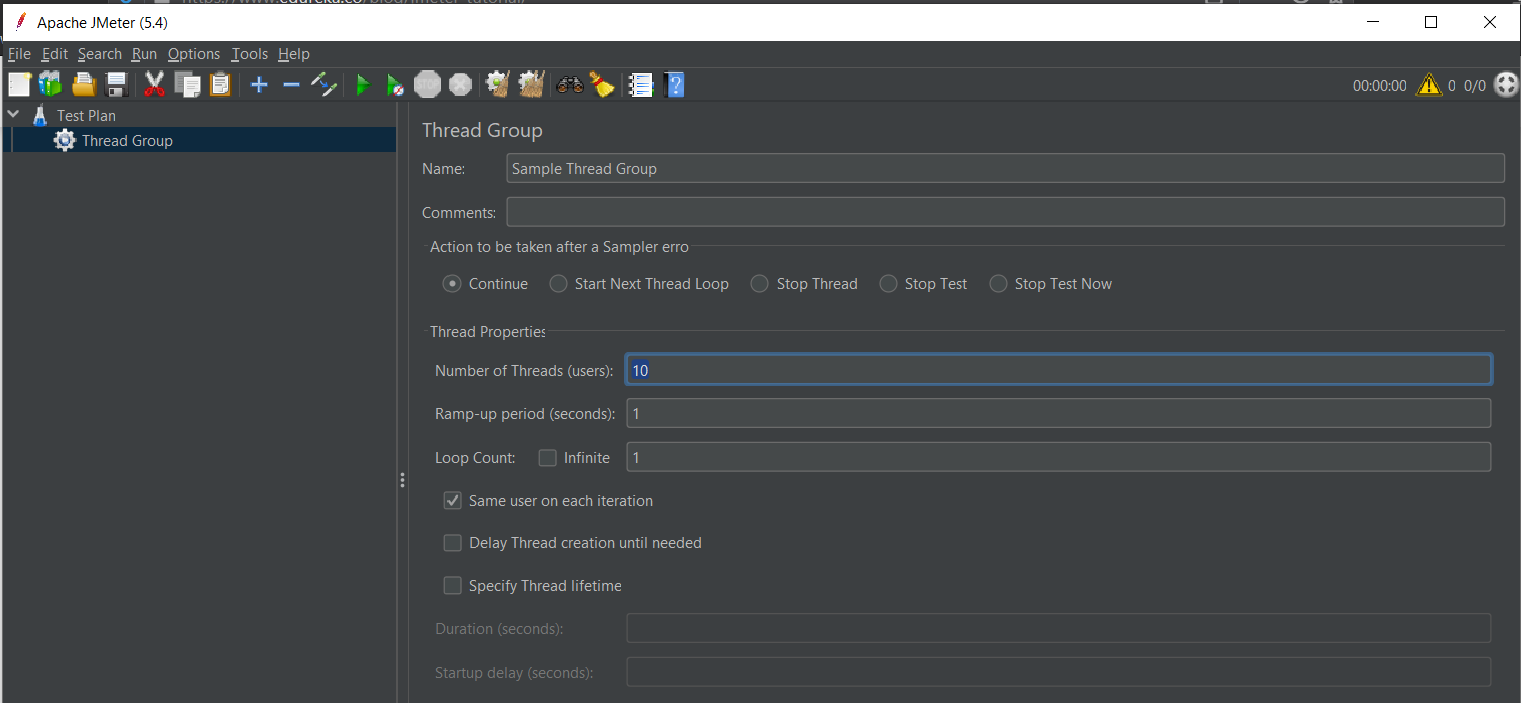
Adding a thread group to the Test Plan
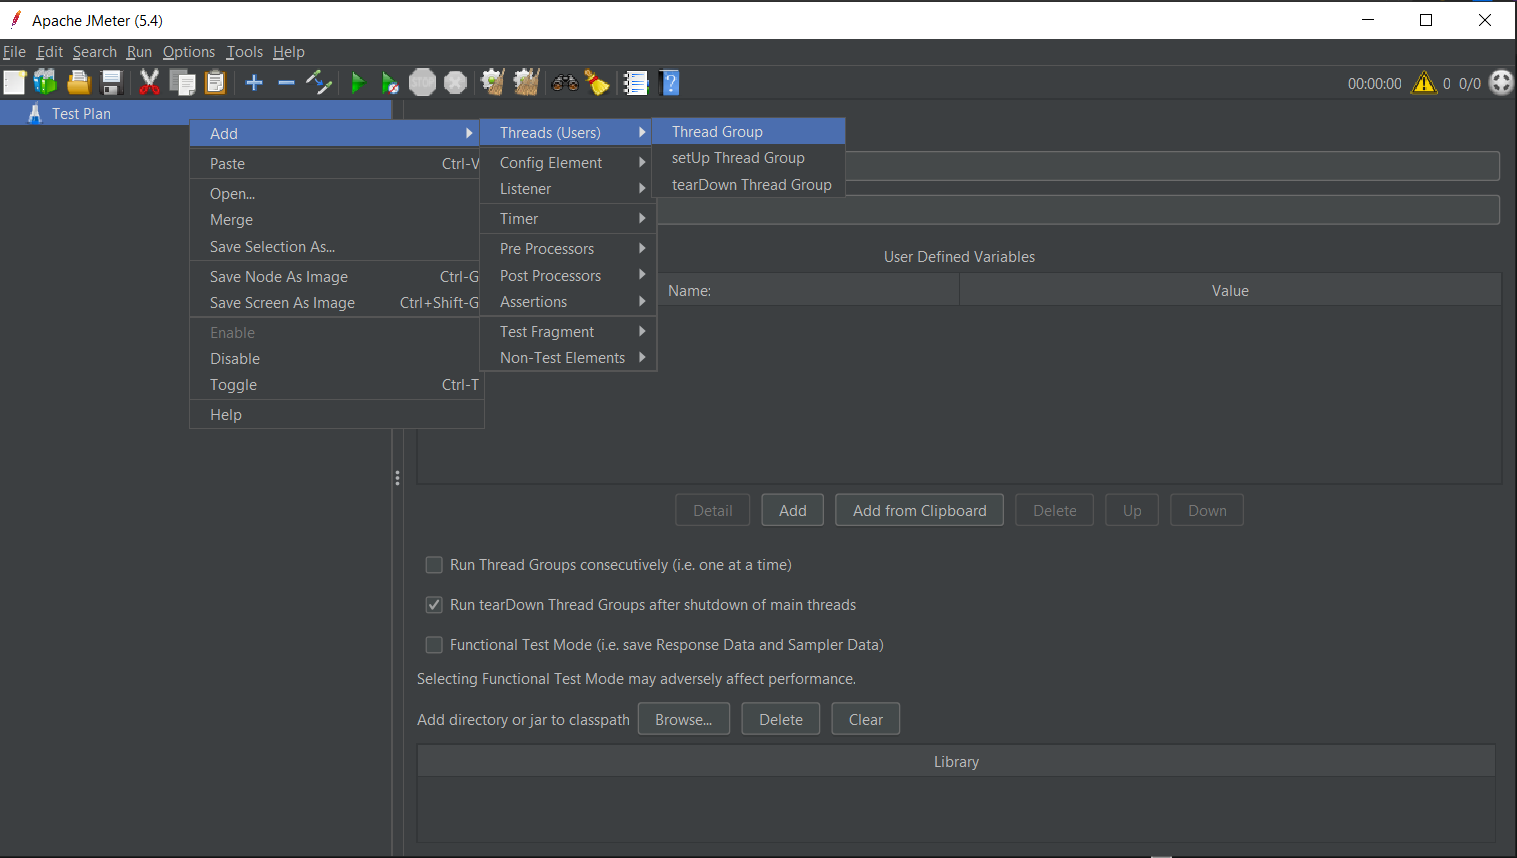
Right-click on the test plan. Click on Add -> Threads (Users) -> Thread Group.
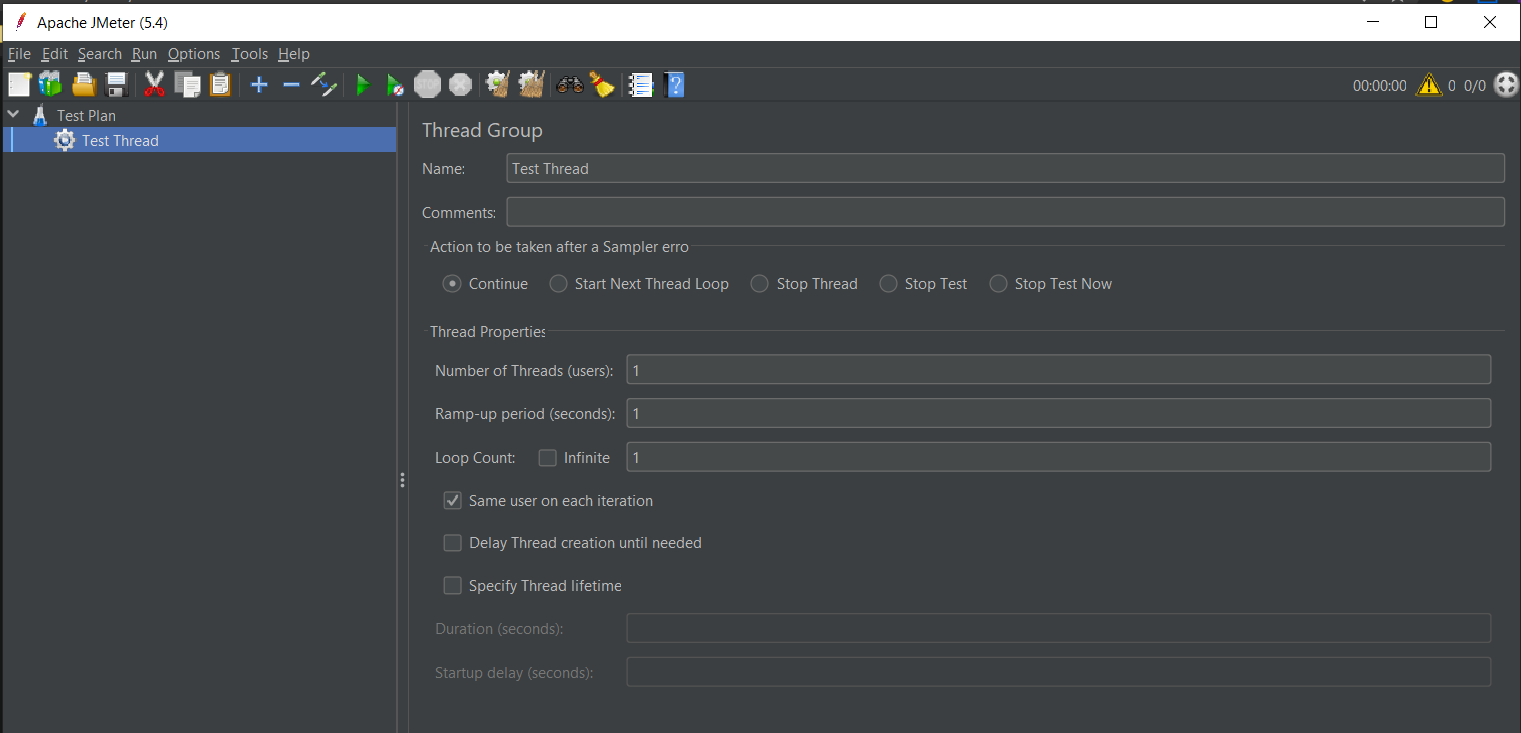
Also, let's into settings present in the Thread Group panel.
Action to be taken after any errors'
If any error occurs during the execution of the test, we can perform the below steps:
- Continue: Running
- Stop Thread: To stop the current thread
- Stop Test: To stop test completely
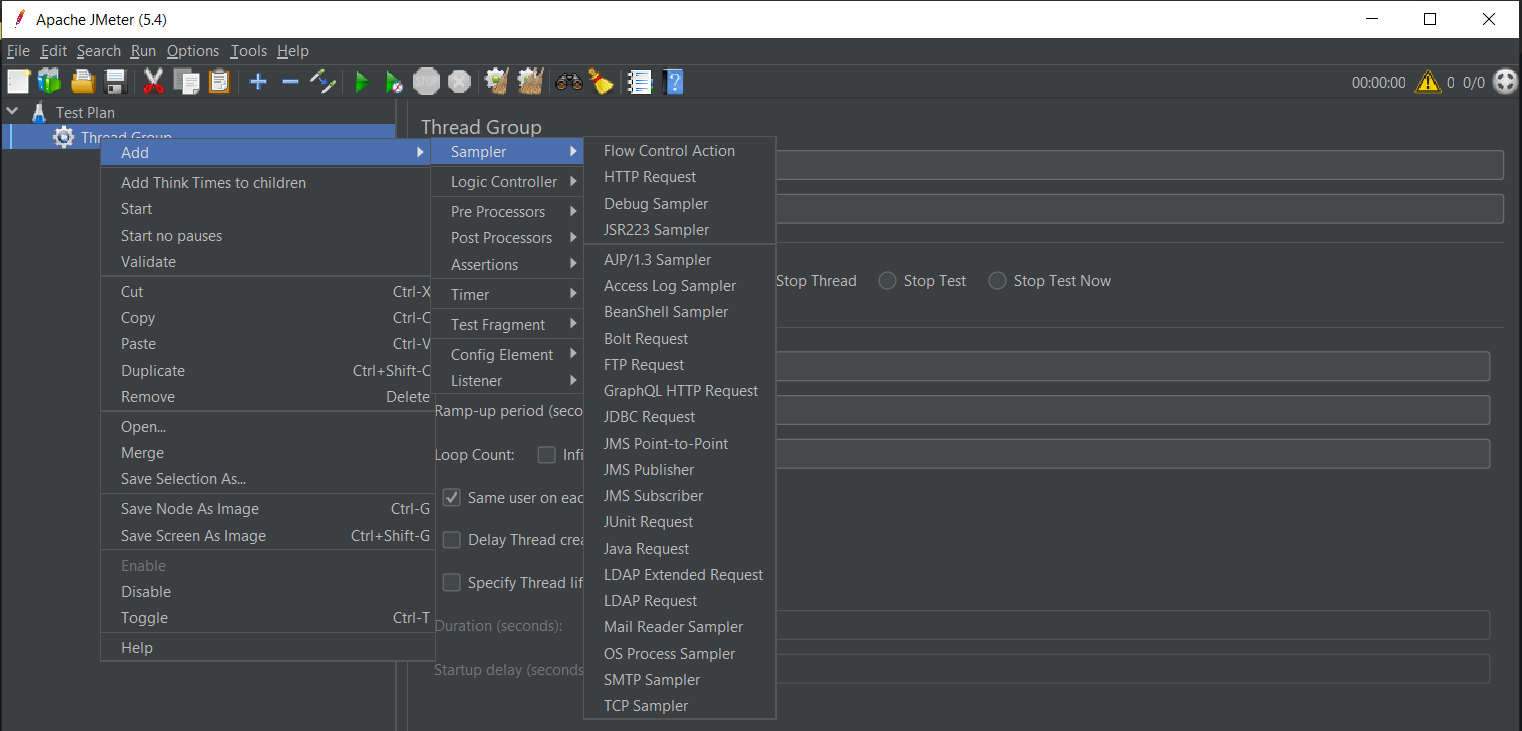
Creating an HTTP request
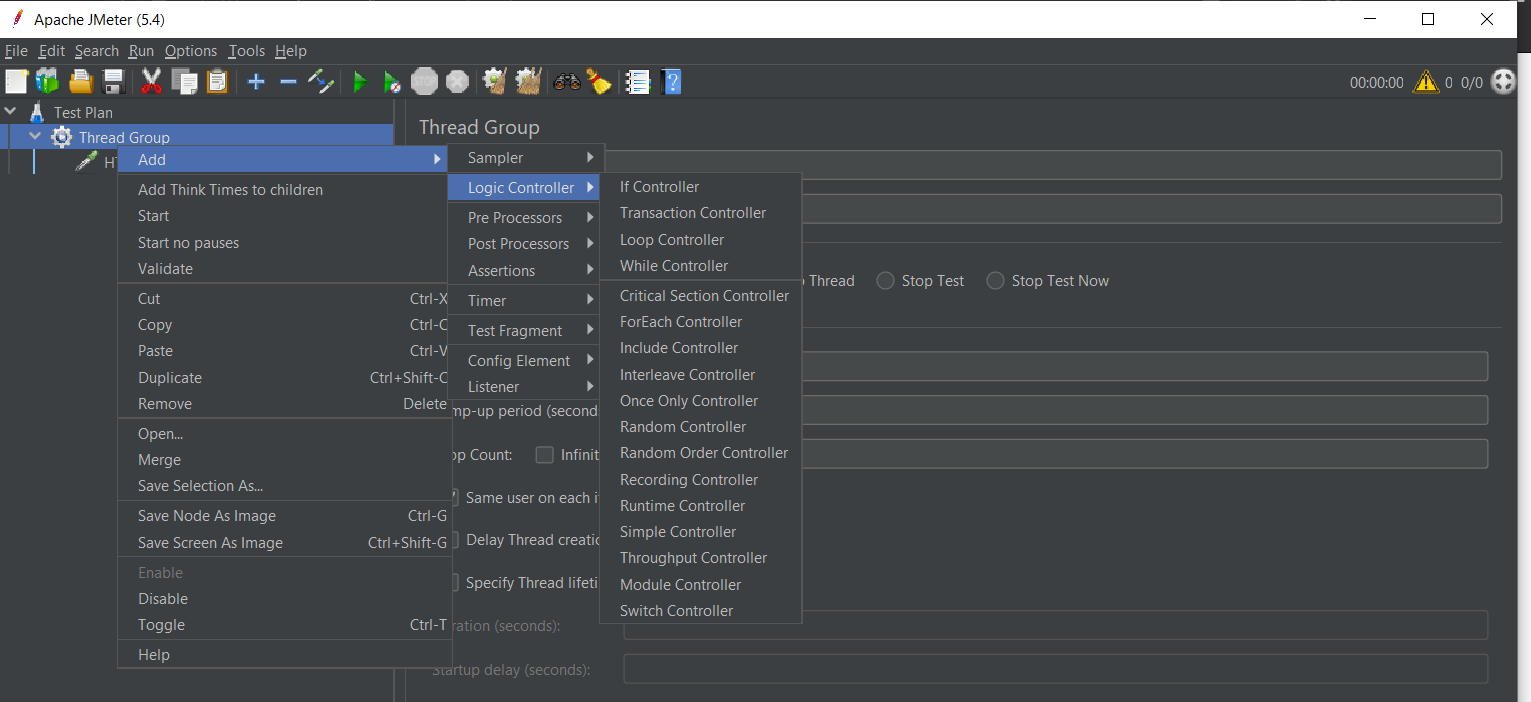
Right-click on the Thread Group and then select Add -> Sampler -> HTTP Request.
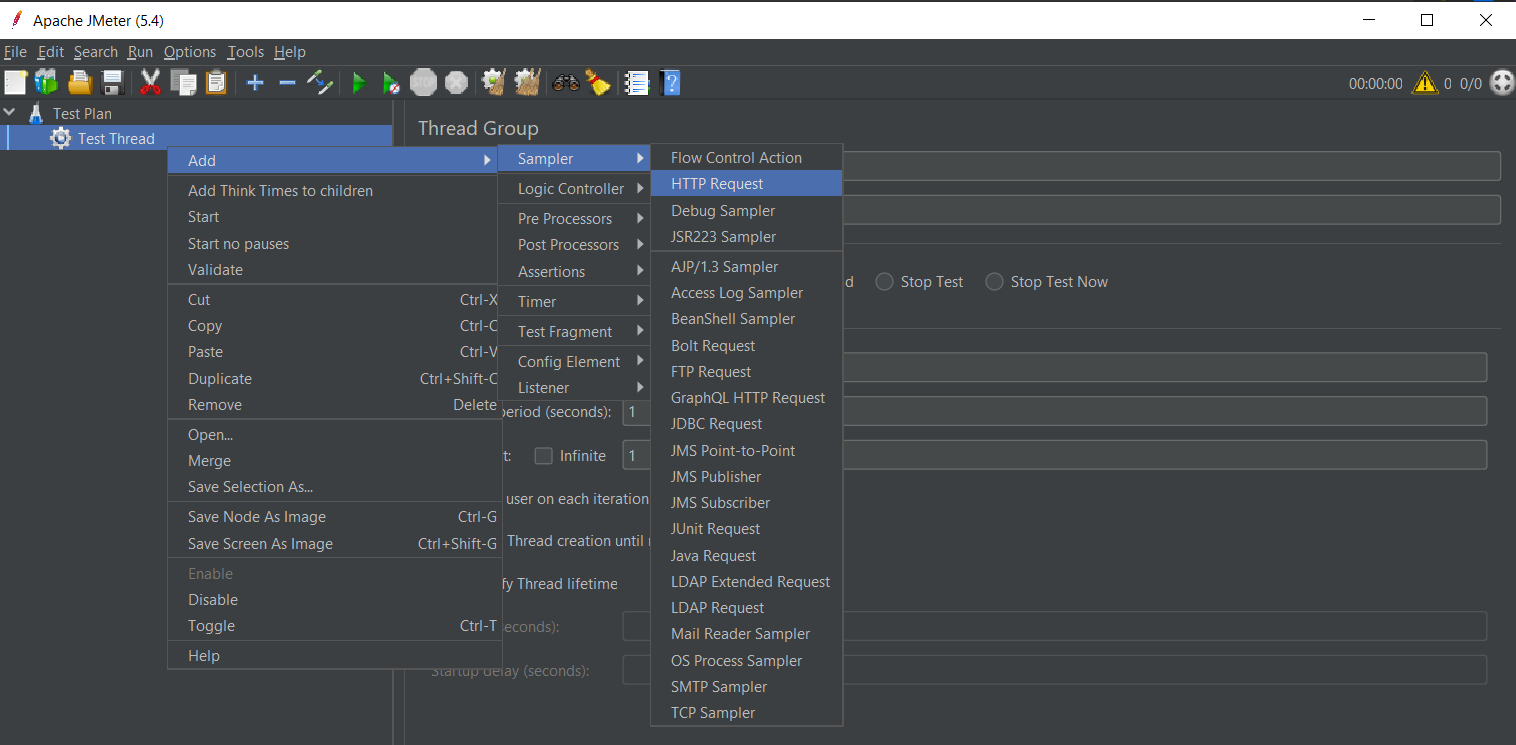
Here, we're going to use a simple GET request to https://jmeter.apache.org/index.html
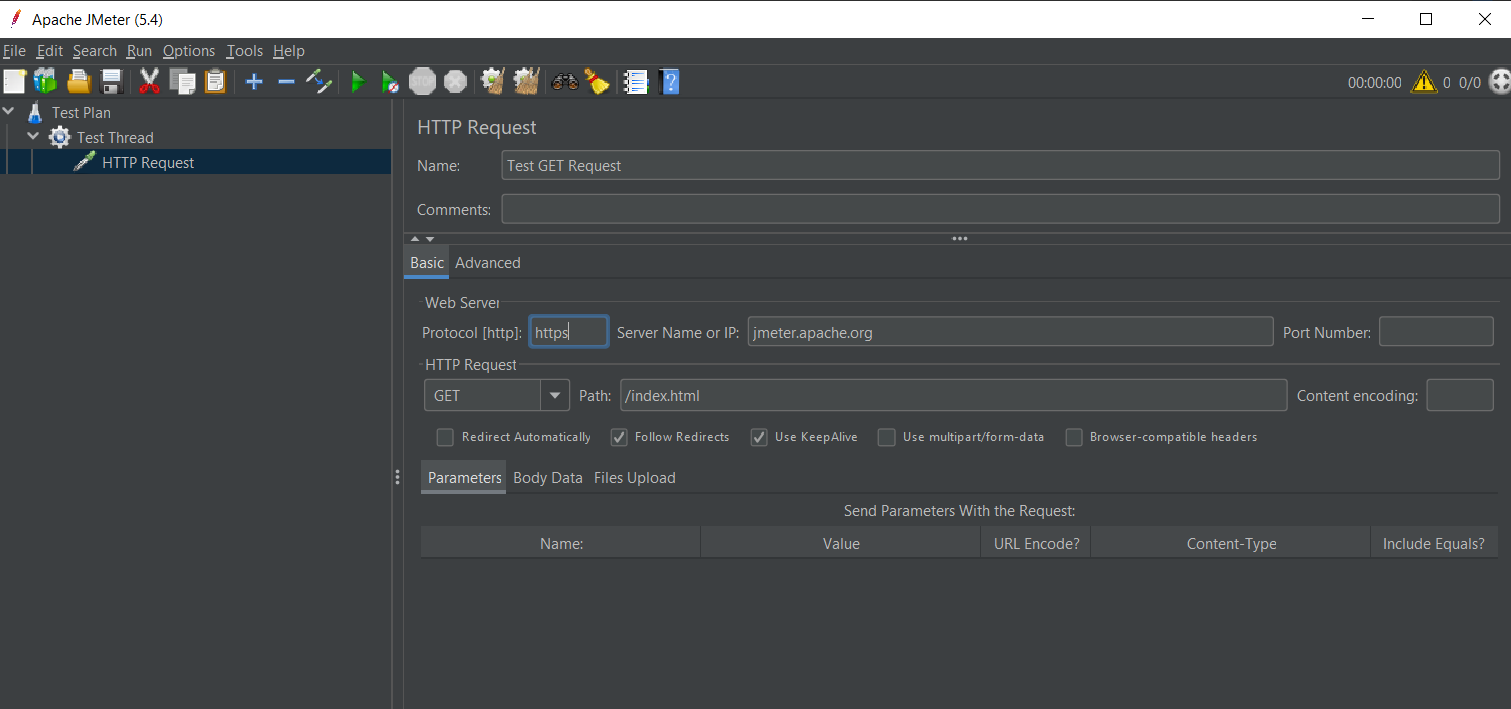
So, below would be the values under the respective columns :
Protocol: HTTPS
Server name or IP: jmeter.apache.org
Port number: (Default HTTPS port, could be omitted)
Method: GET
Path: /index.html
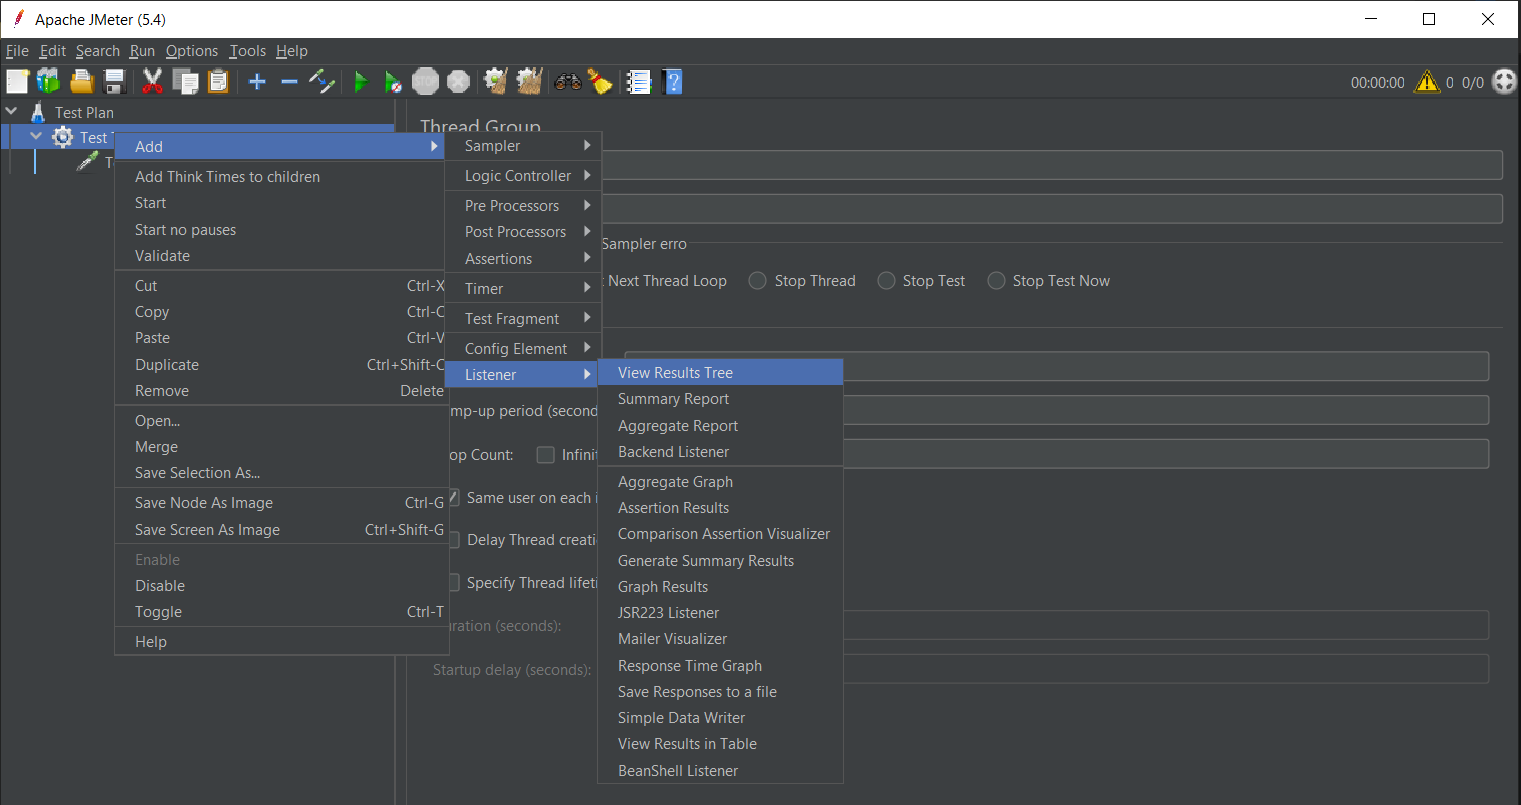
Adding View Result Tree
To see the results after executing our request using the View Result Tree.
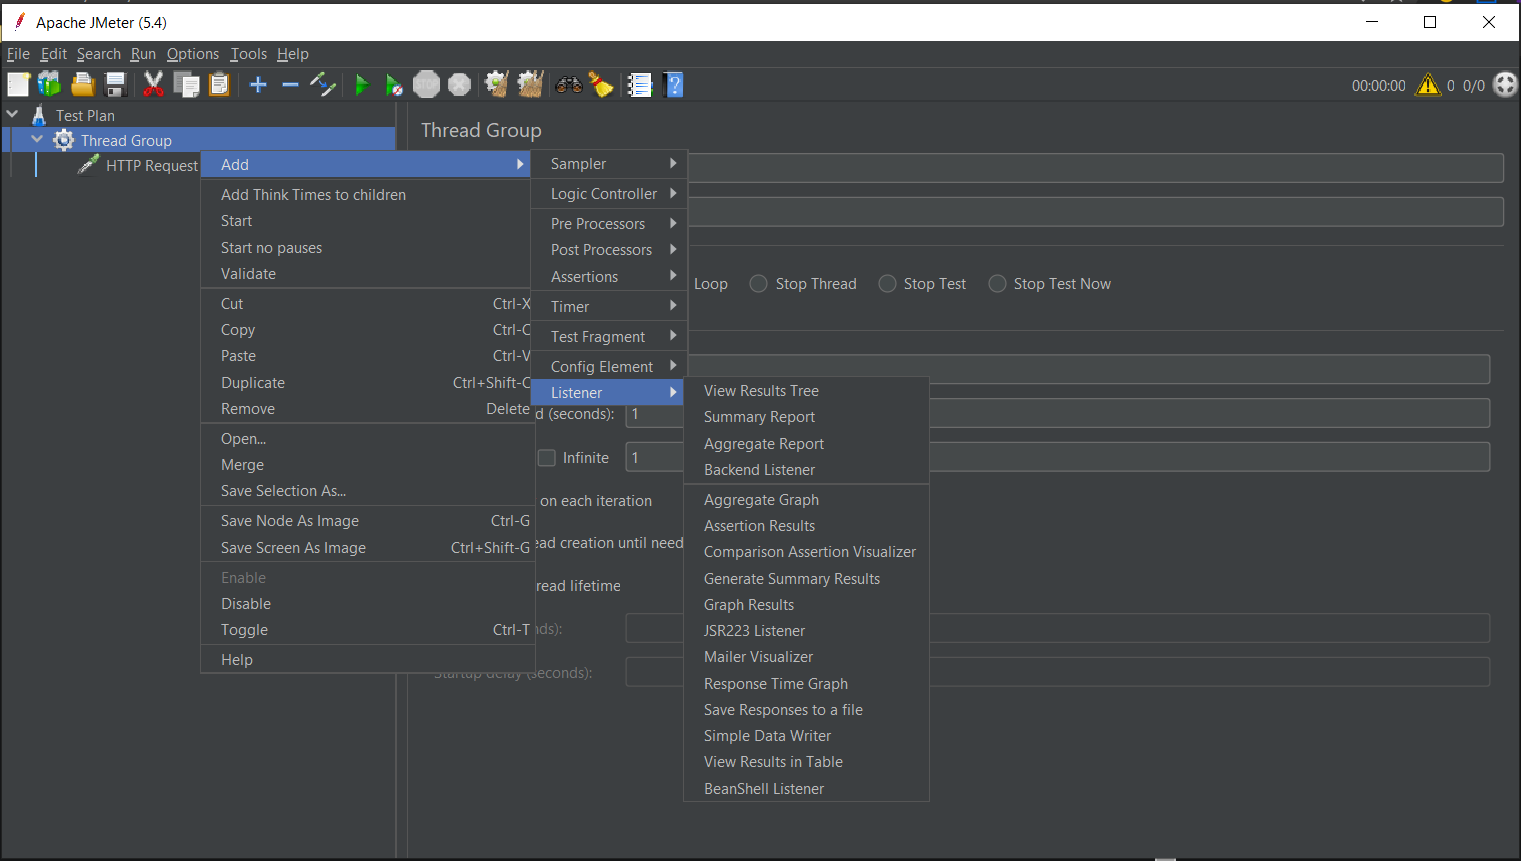
Right-click on the Thread Group and then select Add -> Listener ->View Results Tree.
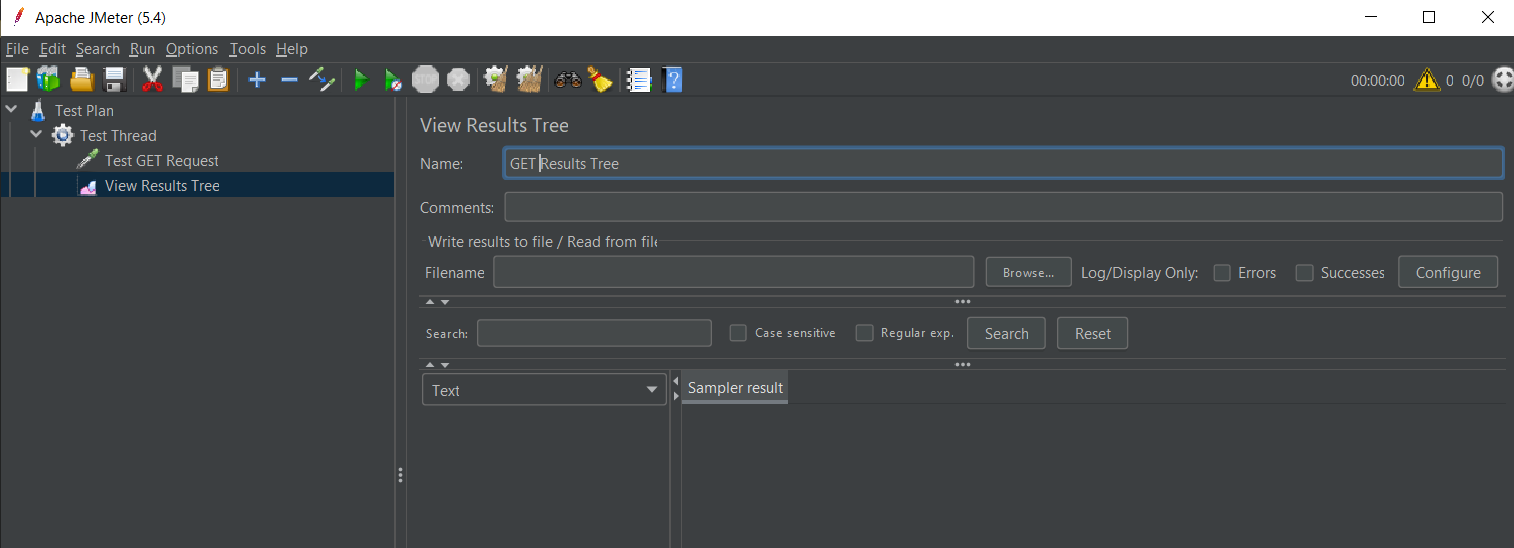
On Click, of Run button, the respective Test Script gets executed -
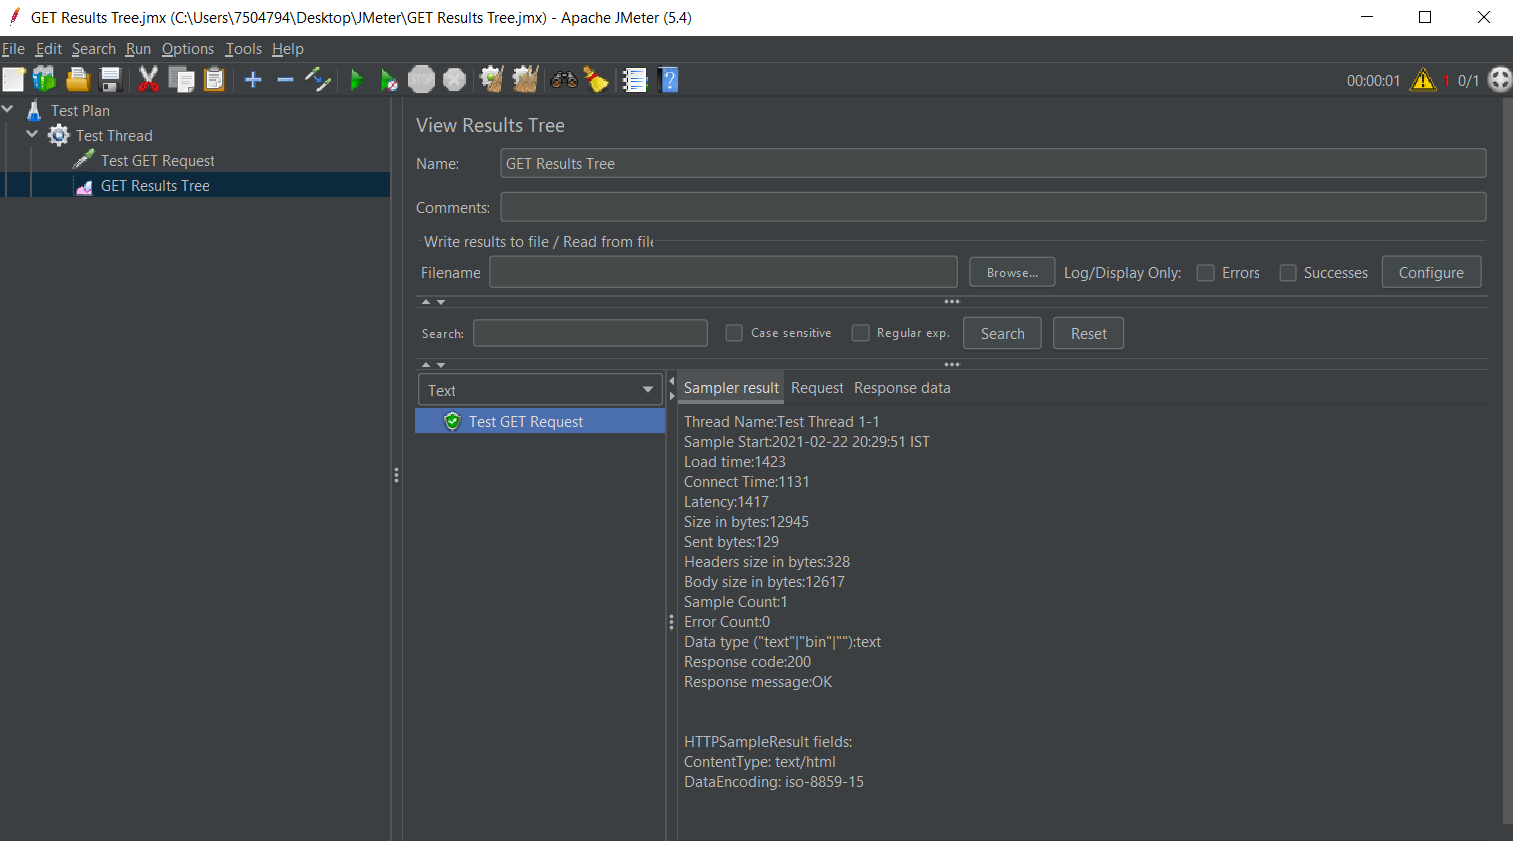
The UI listeners let us see the results and the respective requests executed.
Green colour: Indicates success.
Sampler result: Gives out the metrics of the requests and response times.
Request: This shows the request that has been run.
Response: This shows the response to the request.
JMeter stores up all the requests and responses received. Also, this listener isn't designed to run multiple current users on one Go.
Is the article finished? Not at all!
In the upcoming article, we will check the Performance Testing with CRUD operations.
If you feel this article helpful, don’t forget to add your comments and share. Thank You!!!!
Happy coding! Happy testing!


